Prometheus搭建简单的监控告警系统
说明
使用的操作系统为CentOS 7.6.1810,其他系统请自己根据差异做对应调整
仅用于记录部署过程
告警通知对接了邮件和钉钉机器人
安装
在监控告警系统主机上安装prometheus、alertmanager和grafana
被监控的主机安装各种各样的exporter,每个exporter只监控自身的服务状态
环境准备
# 创建prometheus配置目录
mkdir -p /etc/prometheus /etc/prometheus/rules.d
# 创建prometheus用户
useradd prometheus
# 修改属主属组
chown -R prometheus:prometheus /etc/prometheus
软件包
prometheus
# 下载解压
wget -O - https://github.com/prometheus/prometheus/releases/download/v2.9.2/prometheus-2.9.2.linux-amd64.tar.gz | tar xz

# 创建数据目录
mkdir -p /var/lib/prometheus
chwon -R prometheus:prometheus /var/lib/prometheus

# 拷贝文件到对应位置
cd prometheus-2.9.2.linux-amd64
chown -R prometheus:prometheus prometheus promtool console_libraries consoles prometheus.yml
mv prometheus promtool /usr/local/bin/
mv console_libraries consoles prometheus.yml /etc/prometheus/
alertmanager
# 下载解压
wget -O - https://github.com/prometheus/alertmanager/releases/download/v0.17.0/alertmanager-0.17.0.linux-amd64.tar.gz | tar xz

# 创建数据目录
mkdir -p /var/lib/prometheus
chwon -R prometheus:prometheus /var/lib/prometheus

# 拷贝文件
cd alertmanager-0.17.0.linux-amd64
chown -R prometheus:prometheus alertmanager alertmanager.yml amtool
mv alertmanager amtool /usr/local/bin/
mv alertmanager.yml /etc/prometheus
node_exporter
# 下载解压
wget -O - https://github.com/prometheus/node_exporter/releases/download/v0.18.0/node_exporter-0.18.0.linux-amd64.tar.gz | tar xz
cd node_exporter-0.18.0.linux-amd64
chown prometheus:prometheus node_exporter
# 拷贝文件
mv node_exporter /usr/local/bin/
mysqld_exporter
# 下载解压
wget -O - https://github.com/prometheus/mysqld_exporter/releases/download/v0.11.0/mysqld_exporter-0.11.0.linux-amd64.tar.gz | tar xz
cd mysqld_exporter-0.11.0.linux-amd64
chown prometheus:prometheus mysqld_exporter
# 拷贝文件
mv mysqld_exporter /usr/local/bin/
postgresql_exporter
# 下载解压
wget -O - https://github.com/wrouesnel/postgres_exporter/releases/download/v0.4.7/postgres_exporter_v0.4.7_linux-amd64.tar.gz | tar xz
cd postgres_exporter_v0.4.7_linux-amd64
chown prometheus:prometheus postgres_exporter
# 拷贝文件
mv postgres_exporter /usr/local/bin/
blackbox_exporter
# 下载解压
wget -O - https://github.com/prometheus/blackbox_exporter/releases/download/v0.14.0/blackbox_exporter-0.14.0.linux-amd64.tar.gz | tar xz
cd blackbox_exporter-0.14.0.linux-amd64
chown prometheus:prometheus blackbox_exporter blackbox.yml
# 拷贝文件
mv blackbox_exporter /usr/local/bin/
mv blackbox.yml /etc/prometheus/
grafana
# 下载
wget https://dl.grafana.com/oss/release/grafana-6.1.6-1.x86_64.rpm
yum localinstall grafana-6.1.6-1.x86_64.rpm
配置
Prometheus
/etc/prometheus/prometheus.yml
global:
  scrape_interval: 15s
  scrape_timeout: 10s
  evaluation_interval: 15s
alerting:
  alertmanagers:
  - static_configs:
    - targets:
      - localhost:9093
    scheme: http
    timeout: 10s
rule_files:
- /etc/prometheus/rules.d/*.rules
scrape_configs:
- job_name: prometheus
  honor_timestamps: true
  scrape_interval: 5s
  scrape_timeout: 5s
  metrics_path: /metrics
  scheme: http
  static_configs:
  - targets:
    - localhost:9090
- job_name: node-exporter
  honor_timestamps: true
  scrape_interval: 5s
  scrape_timeout: 5s
  metrics_path: /metrics
  scheme: http
  static_configs:
  - targets:
    - localhost:9100
- job_name: mysqld-exporter
  honor_timestamps: true
  scrape_interval: 5s
  scrape_timeout: 5s
  metrics_path: /metrics
  scheme: http
  static_configs:
  - targets:
    - localhost:9104
- job_name: postgresql-exporter
  honor_timestamps: true
  scrape_interval: 5s
  scrape_timeout: 5s
  metrics_path: /metrics
  scheme: http
  static_configs:
  - targets:
    - localhost:9187
/etc/prometheus/rules.d/host-status.rules
groups:
  - name: host-status-rule
    rules:
    - alert: NodeFilesystemSpaceUsage
      expr: ( 1 - (node_filesystem_avail_bytes{fstype=~"ext[234]|btrfs|xfs|zfs"} / node_filesystem_size_bytes{fstype=~"ext[234]|btrfs|xfs|zfs"}) ) * 100 > 85
      for: 1m
      labels:
        team: node
      annotations:
        summary: "{{$labels.instance}}: 文件系统空间使用率过高"
        description: "{{$labels.instance}}: 文件系统空间使用率超过 85% (当前使用率: {{ $value }})"
    - alert: NodeFilesystemInodeUsage
      expr: ( 1 - (node_filesystem_files_free{fstype=~"ext[234]|btrfs|xfs|zfs"} / node_filesystem_files{fstype=~"ext[234]|btrfs|xfs|zfs"}) ) * 100 > 80
      for: 1m
      labels:
        team: node
      annotations:
        summary: "{{$labels.instance}}: 文件系统inode使用率过高"
        description: "{{$labels.instance}}: 文件系统inode使用率超过 80% (当前使用率: {{ $value }})"
    - alert: NodeFilesystemReadOnly
      expr: node_filesystem_readonly{job="node-exporter",device!~'rootfs'} == 1
      for: 1m
      labels:
        team: node
      annotations:
        summary: "{{$labels.instance}}: 文件系统只读状态"
        description: "{{$labels.instance}}: 文件系统只读状态"
    - alert: NodeMemoryUsage
      expr: (node_memory_MemTotal - (node_memory_MemFree+node_memory_Buffers+node_memory_Cached )) / node_memory_MemTotal * 100 > 80
      for: 1m
      labels:
        team: node
      annotations:
        summary: "{{$labels.instance}}: 内存使用率过高"
        description: "{{$labels.instance}}: 内存使用率过高超过80% (当前使用率: {{ $value }})"
    - alert: NodeCPUUsage
      expr: (100 - (avg by (instance) (irate(node_cpu_seconds_total{mode='idle',job="node-exporter"}[1m])) * 100)) > 80
      for: 1m
      labels:
        team: node
      annotations:
        summary: "{{$labels.instance}}: CPU使用率过高"
        description: "{{$labels.instance}}: CPU使用率超过80% (当前使用率: {{ $value }})"
/etc/prometheus/rules.d/mysql-status.rules
groups:
  - name: MySQLStatsAlert
    rules:
    - alert: MySQL is down
      expr: mysql_up == 0
      for: 1m
      labels:
        severity: critical
      annotations:
        summary: "Instance {{ $labels.instance }} MySQL is down"
        description: "MySQL database is down. This requires immediate action!"
    - alert: open files high
      expr: mysql_global_status_innodb_num_open_files > (mysql_global_variables_open_files_limit) * 0.75
      for: 1m
      labels:
        severity: warning
      annotations:
        summary: "Instance {{ $labels.instance }} open files high"
        description: "Open files is high. Please consider increasing open_files_limit."
    - alert: Read buffer size is bigger than max. allowed packet size
      expr: mysql_global_variables_read_buffer_size > mysql_global_variables_slave_max_allowed_packet
      for: 1m
      labels:
        severity: warning
      annotations:
        summary: "Instance {{ $labels.instance }} Read buffer size is bigger than max. allowed packet size"
        description: "Read buffer size (read_buffer_size) is bigger than max. allowed packet size (max_allowed_packet).This can break your replication."
    - alert: Sort buffer possibly missconfigured
      expr: mysql_global_variables_innodb_sort_buffer_size <256*1024 or mysql_global_variables_read_buffer_size > 4*1024*1024
      for: 1m
      labels:
        severity: warning
      annotations:
        summary: "Instance {{ $labels.instance }} Sort buffer possibly missconfigured"
        description: "Sort buffer size is either too big or too small. A good value for sort_buffer_size is between 256k and 4M."
    - alert: Thread stack size is too small
      expr: mysql_global_variables_thread_stack <196608
      for: 1m
      labels:
        severity: warning
      annotations:
        summary: "Instance {{ $labels.instance }} Thread stack size is too small"
        description: "Thread stack size is too small. This can cause problems when you use Stored Language constructs for example. A typical is 256k for thread_stack_size."
    - alert: Used more than 80% of max connections limited
      expr: mysql_global_status_max_used_connections > mysql_global_variables_max_connections * 0.8
      for: 1m
      labels:
        severity: warning
      annotations:
        summary: "Instance {{ $labels.instance }} Used more than 80% of max connections limited"
        description: "Used more than 80% of max connections limited"
    - alert: InnoDB Force Recovery is enabled
      expr: mysql_global_variables_innodb_force_recovery != 0
      for: 1m
      labels:
        severity: warning
      annotations:
        summary: "Instance {{ $labels.instance }} InnoDB Force Recovery is enabled"
        description: "InnoDB Force Recovery is enabled. This mode should be used for data recovery purposes only. It prohibits writing to the data."
    - alert: InnoDB Log File size is too small
      expr: mysql_global_variables_innodb_log_file_size < 16777216
      for: 1m
      labels:
        severity: warning
      annotations:
        summary: "Instance {{ $labels.instance }} InnoDB Log File size is too small"
        description: "The InnoDB Log File size is possibly too small. Choosing a small InnoDB Log File size can have significant performance impacts."
    - alert: InnoDB Flush Log at Transaction Commit
      expr: mysql_global_variables_innodb_flush_log_at_trx_commit != 1
      for: 1m
      labels:
        severity: warning
      annotations:
        summary: "Instance {{ $labels.instance }} InnoDB Flush Log at Transaction Commit"
        description: "InnoDB Flush Log at Transaction Commit is set to a values != 1. This can lead to a loss of commited transactions in case of a power failure."
    - alert: Table definition cache too small
      expr: mysql_global_status_open_table_definitions > mysql_global_variables_table_definition_cache
      for: 1m
      labels:
        severity: page
      annotations:
        summary: "Instance {{ $labels.instance }} Table definition cache too small"
        description: "Your Table Definition Cache is possibly too small. If it is much too small this can have significant performance impacts!"
    - alert: Table open cache too small
      expr: mysql_global_status_open_tables >mysql_global_variables_table_open_cache * 99/100
      for: 1m
      labels:
        severity: page
      annotations:
        summary: "Instance {{ $labels.instance }} Table open cache too small"
        description: "Your Table Open Cache is possibly too small (old name Table Cache). If it is much too small this can have significant performance impacts!"
    - alert: Thread stack size is possibly too small
      expr: mysql_global_variables_thread_stack < 262144
      for: 1m
      labels:
        severity: page
      annotations:
        summary: "Instance {{ $labels.instance }} Thread stack size is possibly too small"
        description: "Thread stack size is possibly too small. This can cause problems when you use Stored Language constructs for example. A typical is 256k for thread_stack_size."
    - alert: InnoDB Plugin is enabled
      expr: mysql_global_variables_ignore_builtin_innodb == 1
      for: 1m
      labels:
        severity: page
      annotations:
        summary: "Instance {{ $labels.instance }} InnoDB Plugin is enabled"
        description: "InnoDB Plugin is enabled"
    - alert: Binary Log is disabled
      expr: mysql_global_variables_log_bin != 1
      for: 1m
      labels:
        severity: warning
      annotations:
        summary: "Instance {{ $labels.instance }} Binary Log is disabled"
        description: "Binary Log is disabled. This prohibits you to do Point in Time Recovery (PiTR)."
    - alert: Binlog Cache size too small
      expr: mysql_global_variables_binlog_cache_size < 1048576
      for: 1m
      labels:
        severity: page
      annotations:
        summary: "Instance {{ $labels.instance }} Binlog Cache size too small"
        description: "Binlog Cache size is possibly to small. A value of 1 Mbyte or higher is OK."
    - alert: Binlog Transaction Cache size too small
      expr: mysql_global_variables_binlog_cache_size  < 1048576
      for: 1m
      labels:
        severity: page
      annotations:
        summary: "Instance {{ $labels.instance }} Binlog Transaction Cache size too small"
        description: "Binlog Transaction Cache size is possibly to small. A value of 1 Mbyte or higher is typically OK."
/etc/prometheus/rules.d/postgresql-status.rules
groups:
- name: PostgreSQL-Status-Alert
  rules:

########## EXPORTER RULES ##########
  - alert: PGExporterScrapeError
    expr: pg_exporter_last_scrape_error > 0
    for: 60s
    labels:
      service: postgresql
      severity: critical
      severity_num: 300
    annotations:
      summary: 'Postgres Exporter running on {{ $labels.job }} (instance: {{ $labels.instance }}) is encountering scrape errors processing queries. Error count: ( {{ $value }} )'

  - alert: NodeExporterScrapeError
    expr: node_textfile_scrape_error > 0
    for: 60s
    labels:
      service: system
      severity: critical
      severity_num: 300
    annotations:
      summary: 'Node Exporter running on {{ $labels.job }} (instance: {{ $labels.instance }}) is encountering scrape errors processing custom metrics.  Error count: ( {{ $value }} )'


########## POSTGRESQL RULES ##########
  - alert: PGIsUp
    expr: pg_up < 1
    for: 60s
    labels:
      service: postgresql
      severity: critical
      severity_num: 300
    annotations:
      summary: 'postgres_exporter running on {{ $labels.job }} is unable to communicate with the configured database'


# Whether a system switches from primary to replica or vice versa must be configured per named job.
# No way to tell what value a system is supposed to be without a rule expression for that specific system
# 2 to 1 means it changed from primary to replica. 1 to 2 means it changed from replica to primary
# Set this alert for each system that you want to monitor a recovery status change
# Below is an example for a target job called "Replica" and watches for the value to change above 1 which means it's no longer a replica
#
#  - alert: PGRecoveryStatusSwitch_Replica
#    expr: ccp_is_in_recovery_status{job="Replica"} > 1
#    for: 60s
#    labels:
#      service: postgresql
#      severity: critical
#      severity_num: 300
#    annotations:
#      summary: '{{ $labels.job }} has changed from replica to primary'


# Absence alerts must be configured per named job, otherwise there's no way to know which job is down
# Below is an example for a target job called "Prod"
#  - alert: PGConnectionAbsent
#    expr: absent(ccp_connection_stats_max_connections{job="Prod"})
#    for: 10s
#    labels:
#      service: postgresql
#      severity: critical
#      severity_num: 300
#    annotations:
#      description: 'Connection metric is absent from target (Prod). Check that postgres_exporter can connect to PostgreSQL.'


  - alert: PGIdleTxn
    expr: ccp_connection_stats_max_idle_in_txn_time > 300
    for: 60s
    labels:
      service: postgresql
      severity: warning
      severity_num: 200
    annotations:
      description: '{{ $labels.job }} has at least one session idle in transaction for over 5 minutes.'
      summary: 'PGSQL Instance idle transactions'

  - alert: PGIdleTxn
    expr: ccp_connection_stats_max_idle_in_txn_time > 900
    for: 60s
    labels:
      service: postgresql
      severity: critical
      severity_num: 300
    annotations:
      description: '{{ $labels.job }} has at least one session idle in transaction for over 15 minutes.'
      summary: 'PGSQL Instance idle transactions'

  - alert: PGQueryTime
    expr: ccp_connection_stats_max_query_time > 43200
    for: 60s
    labels:
      service: postgresql
      severity: warning
      severity_num: 200
    annotations:
      description: '{{ $labels.job }} has at least one query running for over 12 hours.'
      summary: 'PGSQL Max Query Runtime'

  - alert: PGQueryTime
    expr: ccp_connection_stats_max_query_time > 86400
    for: 60s
    labels:
      service: postgresql
      severity: critical
      severity_num: 300
    annotations:
      description: '{{ $labels.job }} has at least one query running for over 1 day.'
      summary: 'PGSQL Max Query Runtime'

  - alert: PGConnPerc
    expr: 100 * (ccp_connection_stats_total / ccp_connection_stats_max_connections) > 75
    for: 60s
    labels:
      service: postgresql
      severity: warning
      severity_num: 200
    annotations:
      description: '{{ $labels.job }} is using 75% or more of available connections ({{ $value }}%)'
      summary: 'PGSQL Instance connections'

  - alert: PGConnPerc
    expr: 100 * (ccp_connection_stats_total / ccp_connection_stats_max_connections) > 90
    for: 60s
    labels:
      service: postgresql
      severity: critical
      severity_num: 300
    annotations:
      description: '{{ $labels.job }} is using 90% or more of available connections ({{ $value }}%)'
      summary: 'PGSQL Instance connections'

  - alert: PGDBSize
    expr: ccp_database_size > 1.073741824e+11
    for: 60s
    labels:
      service: postgresql
      severity: warning
      severity_num: 200
    annotations:
      description: 'PGSQL Instance {{ $labels.job }} over 100GB in size: {{ $value }} bytes'
      summary: 'PGSQL Instance size warning'

  - alert: PGDBSize
    expr: ccp_database_size > 2.68435456e+11
    for: 60s
    labels:
      service: postgresql
      severity: critical
      severity_num: 300
    annotations:
      description: 'PGSQL Instance {{ $labels.job }} over 250GB in size: {{ $value }} bytes'
      summary: 'PGSQL Instance size critical'

  - alert: PGReplicationByteLag
    expr: ccp_replication_status_byte_lag > 5.24288e+07
    for: 60s
    labels:
      service: postgresql
      severity: warning
      severity_num: 200
    annotations:
      description: 'PGSQL Instance {{ $labels.job }} has at least one replica lagging over 50MB behind.'
      summary: 'PGSQL Instance replica lag warning'

  - alert: PGReplicationByteLag
    expr: ccp_replication_status_byte_lag > 1.048576e+08
    for: 60s
    labels:
      service: postgresql
      severity: critical
      severity_num: 300
    annotations:
      description: 'PGSQL Instance {{ $labels.job }} has at least one replica lagging over 100MB behind.'
      summary: 'PGSQL Instance replica lag warning'

  - alert: PGReplicationSlotsInactive
    expr: ccp_replication_slots_active == 0
    for: 60s
    labels:
      service: postgresql
      severity: critical
      severity_num: 300
    annotations:
      description: 'PGSQL Instance {{ $labels.job }} has one or more inactive replication slots'
      summary: 'PGSQL Instance inactive replication slot'

  - alert: PGXIDWraparound
    expr: ccp_transaction_wraparound_percent_towards_wraparound > 50
    for: 60s
    labels:
      service: postgresql
      severity: warning
      severity_num: 200
    annotations:
      description: 'PGSQL Instance {{ $labels.job }} is over 50% towards transaction id wraparound.'
      summary: 'PGSQL Instance {{ $labels.job }} transaction id wraparound imminent'

  - alert: PGXIDWraparound
    expr: ccp_transaction_wraparound_percent_towards_wraparound > 75
    for: 60s
    labels:
      service: postgresql
      severity: critical
      severity_num: 300
    annotations:
      description: 'PGSQL Instance {{ $labels.job }} is over 75% towards transaction id wraparound.'
      summary: 'PGSQL Instance transaction id wraparound imminent'

  - alert: PGEmergencyVacuum
    expr: ccp_transaction_wraparound_percent_towards_emergency_autovac > 75
    for: 60s
    labels:
      service: postgresql
      severity: warning
      severity_num: 200
    annotations:
      description: 'PGSQL Instance {{ $labels.job }} is over 75% towards emergency autovacuum processes beginning'
      summary: 'PGSQL Instance emergency vacuum imminent'

  - alert: PGEmergencyVacuum
    expr: ccp_transaction_wraparound_percent_towards_emergency_autovac > 90
    for: 60s
    labels:
      service: postgresql
      severity: critical
      severity_num: 300
    annotations:
      description: 'PGSQL Instance {{ $labels.job }} is over 90% towards emergency autovacuum processes beginning'
      summary: 'PGSQL Instance emergency vacuum imminent'

  - alert: PGArchiveCommandStatus
    expr: ccp_archive_command_status_seconds_since_last_fail > 300
    for: 60s
    labels:
        service: postgresql
        severity: critical
        severity_num: 300
    annotations:
        description: 'PGSQL Instance {{ $labels.job }} has a recent failing archive command'
        summary: 'Seconds since the last recorded failure of the archive_command'

  - alert: PGSequenceExhaustion
    expr: ccp_sequence_exhaustion_count > 0
    for: 60s
    labels:
        service: postgresql
        severity: critical
        severity_num: 300
    annotations:
        description: 'Count of sequences on instance {{ $labels.job }} at over 75% usage: {{ $value }}. Run following query to see full sequence status: SELECT * FROM monitor.sequence_status() WHERE percent >= 75'


########## SYSTEM RULES ##########
  - alert: ExporterDown
    expr: avg_over_time(up[5m]) < 0.9
    for: 10s
    labels:
      service: system
      severity: critical
      severity_num: 300
    annotations:
      description: 'Metrics exporter service for {{ $labels.job }} running on {{ $labels.instance }} has been down at least 50% of the time for the last 5 minutes. Service may be flapping or down.'
      summary: 'Prometheus Exporter Service Down'

  - alert: DiskUsagePerc
    expr: (100 - 100 * sum(node_filesystem_avail_bytes{device!~"tmpfs|by-uuid",fstype=~"xfs|ext"} / node_filesystem_size_bytes{device!~"tmpfs|by-uuid",fstype=~"xfs|ext"}) BY (job,device)) > 70
    for: 2m
    labels:
      service: system
      severity: warning
      severity_num: 200
    annotations:
      description: 'Disk usage on target {{ $labels.job }} at {{ $value }}%'

  - alert: DiskUsagePerc
    expr: (100 - 100 * sum(node_filesystem_avail_bytes{device!~"tmpfs|by-uuid",fstype=~"xfs|ext"} / node_filesystem_size_bytes{device!~"tmpfs|by-uuid",fstype=~"xfs|ext"}) BY (job,device)) > 85
    for: 2m
    labels:
      service: system
      severity: critical
      severity_num: 300
    annotations:
      description: 'Disk usage on target {{ $labels.job }} at {{ $value }}%'

  - alert: DiskFillPredict
    expr: predict_linear(node_filesystem_free_bytes{device!~"tmpfs|by-uuid",fstype=~"xfs|ext"}[1h], 4 * 3600) < 0
    for: 5m
    labels:
      service: system
      severity: warning
      severity_num: 200
    annotations:
      description: '(EXPERIMENTAL) Disk {{ $labels.device }} on target {{ $labels.job }} is predicted to fill in 4 hrs based on current usage'

  - alert: SystemLoad5m
    expr: node_load5 > 5
    for: 10m
    labels:
      service: system
      severity: warning
      severity_num: 200
    annotations:
      description: 'System load for target {{ $labels.job }} is high ({{ $value }})'

  - alert: SystemLoad5m
    expr: node_load5 > 10
    for: 10m
    labels:
      service: system
      severity: critical
      severity_num: 300
    annotations:
      description: 'System load for target {{ $labels.job }} is high ({{ $value }})'

  - alert: MemoryAvailable
    expr: (100 * (node_memory_Available_bytes) / node_memory_MemTotal_bytes) < 25
    for: 1m
    labels:
      service: system
      severity: warning
      severity_num: 200
    annotations:
      description: 'Memory available for target {{ $labels.job }} is at {{ $value }}%'

  - alert: MemoryAvailable
    expr: (100 * (node_memory_MemAvailable_bytes) / node_memory_MemTotal_bytes) < 10
    for: 1m
    labels:
      service: system
      severity: critical
      severity_num: 300
    annotations:
      description: 'Memory available for target {{ $labels.job }} is at {{ $value }}%'

  - alert: SwapUsage
    expr: (100 - (100 * (node_memory_SwapFree_bytes / node_memory_SwapTotal_bytes))) > 60
    for: 1m
    labels:
      service: system
      severity: warning
      severity_num: 200
    annotations:
      description: 'Swap usage for target {{ $labels.job }} is at {{ $value }}%'

  - alert: SwapUsage
    expr: (100 - (100 * (node_memory_SwapFree_byte / node_memory_SwapTotal_bytes))) > 80
    for: 1m
    labels:
      service: system
      severity: critical
      severity_num: 300
    annotations:
      description: 'Swap usage for target {{ $labels.job }} is at {{ $value }}%'


########## PGBACKREST RULES ##########
#
# Uncomment and customize one or more of these rules to monitor your pgbackrest backups.
# Full backups are considered the equivalent of both differentials and incrementals since both are based on the last full
#   And differentials are considered incrementals since incrementals will be based off the last diff if one exists
#   This avoid false alerts, for example when you don't run diff/incr backups on the days that you run a full
# Stanza should also be set if different intervals are expected for each stanza.
#   Otherwise rule will be applied to all stanzas returned on target system if not set.
# Otherwise, all backups returned by the pgbackrest info command run from where the database exists will be checked
#
# Relevant metric names are:
#   ccp_backrest_last_full_time_since_completion_seconds
#   ccp_backrest_last_incr_time_since_completion_seconds
#   ccp_backrest_last_diff_time_since_completion_seconds
#
#  - alert: PGBackRestLastCompletedFull_main
#    expr: ccp_backrest_last_full_backup_time_since_completion_seconds{stanza="main"} > 604800
#    for: 60s
#    labels:
#       service: postgresql
#       severity: critical
#       severity_num: 300
#    annotations:
#       summary: 'Full backup for stanza [main] on system {{ $labels.job }} has not completed in the last week.'
#
#  - alert: PGBackRestLastCompletedIncr_main
#    expr: ccp_backrest_last_incr_backup_time_since_completion_seconds{stanza="main"} > 86400
#    for: 60s
#    labels:
#       service: postgresql
#       severity: critical
#       severity_num: 300
#    annotations:
#       summary: 'Incremental backup for stanza [main] on system {{ $labels.job }} has not completed in the last 24 hours.'
#
#
# Runtime monitoring is handled with a single metric:
#
#   ccp_backrest_last_runtime_backup_runtime_seconds
#
# Runtime monitoring should have the "backup_type" label set.
#   Otherwise the rule will apply to the last run of all backup types returned (full, diff, incr)
# Stanza should also be set if runtimes per stanza have different expected times
#
#  - alert: PGBackRestLastRuntimeFull_main
#    expr: ccp_backrest_last_runtime_backup_runtime_seconds{backup_type="full", stanza="main"} > 14400
#    for: 60s
#    labels:
#       service: postgresql
#       severity: critical
#       severity_num: 300
#    annotations:
#       summary: 'Expected runtime of full backup for stanza [main] has exceeded 4 hours'
#
#  - alert: PGBackRestLastRuntimeDiff_main
#    expr: ccp_backrest_last_runtime_backup_runtime_seconds{backup_type="diff", stanza="main"} > 3600
#    for: 60s
#    labels:
#       service: postgresql
#       severity: critical
#       severity_num: 300
#    annotations:
#       summary: 'Expected runtime of diff backup for stanza [main] has exceeded 1 hour'
##
#
## If the pgbackrest command fails to run, the metric disappears from the exporter output and the alert never fires.
## An absence alert must be configured explicitly for each target (job) that backups are being monitored.
## Checking for absence of just the full backup type should be sufficient (no need for diff/incr).
## Note that while the backrest check command failing will likely also cause a scrape error alert, the addition of this
## check gives a clearer answer as to what is causing it and that something is wrong with the backups.
#
#  - alert: PGBackrestAbsentFull_Prod
#    expr: absent(ccp_backrest_last_full_backup_time_since_completion_seconds{job="Prod"})
#    for: 10s
#    labels:
#      service: postgresql
#      severity: critical
#      severity_num: 300
#    annotations:
#      description: 'Backup Full status missing for Prod. Check that pgbackrest info command is working on target system.'
Alertmanager
/etc/prometheus/alertmanager.yml
global:
  resolve_timeout: 5m
  http_config: {}
  smtp_from: monitor@example.com
  smtp_hello: localhost
  smtp_smarthost: smtp.example.com:465
  smtp_auth_username: monitor@example.com
  smtp_auth_password: '这里写密码'
  smtp_require_tls: false
  pagerduty_url: https://events.pagerduty.com/v2/enqueue
  hipchat_api_url: https://api.hipchat.com/
  opsgenie_api_url: https://api.opsgenie.com/
  wechat_api_url: https://qyapi.weixin.qq.com/cgi-bin/
  victorops_api_url: https://alert.victorops.com/integrations/generic/20131114/alert/
route:
  # 这里配置默认路由到'default-receiver'
  receiver: default-receiver
  group_by:
  - alertname
  - cluster
  group_wait: 10s
  group_interval: 10s
  repeat_interval: 1h
inhibit_rules:
- source_match:
    severity: critical
  target_match:
    severity: warning
  equal:
  - alertname
  - dev
  - instance
receivers:
- name: default-receiver
  email_configs:
  - send_resolved: false
    to: monitor@example.com
    from: monitor@example.com
    hello: localhost
    smarthost: smtp.example.com:465
    auth_username: monitor@example.com
    auth_password: '这里写密码'
    headers:
      From: monitor@example.com
      Subject: '{{ template "email.default.subject" . }}'
      To: monitor@example.com
    html: '{{ template "email.default.html" . }}'
    require_tls: false
  # 配置钉钉机器人
  webhook_configs:
  - send_resolved: false
    url: http://localhost:8060/dingtalk/webhook001/send
# 配置钉钉机器人
- name: dingtalk002
  webhook_configs:
  - send_resolved: false
    url: http://localhost:8060/dingtalk/webhook002/send
templates: []
配置dingtalk webhook程序
# 这里偷懒用docker跑钉钉的webhook
docker run -d \
           --restart=always \
           --name prometheus-webhook-dingtalk \
           -p 8060:8060 \
           -v /usr/share/zoneinfo/Asia/Shanghai:/etc/localtime:ro \
           timonwong/prometheus-webhook-dingtalk \
           --ding.profile="webhook001=https://oapi.dingtalk.com/robot/send?access_token=xxxxxxxxxxxx" \
           --ding.profile="webhook002=https://oapi.dingtalk.com/robot/send?access_token=yyyyyyyyyyy"
blackbox_exporter
/etc/prometheus/backbox_exporter.yml
没空搞,占个位
mysqld_exporter
需要创建用于监控的数据库用户
CREATE USER 'prometheus'@'127.0.0.1' IDENTIFIED BY 'prometheus_password' WITH MAX_USER_CONNECTIONS 3;
GRANT PROCESS, REPLICATION CLIENT, SELECT ON *.* TO 'prometheus'@'127.0.0.1';
flush privileges;
postgresql_exporter
根据需求决定是否使用superuser作为postgresql_exporter的数据库用户
如果要创建专用用户可以参照下面的方式创建用户
# 创建postgresql_exporter专用用户
CREATE USER postgres_exporter PASSWORD 'password';
ALTER USER postgres_exporter SET SEARCH_PATH TO postgres_exporter,pg_catalog;
# 创建schema
CREATE SCHEMA postgres_exporter;
# 授权schema
GRANT USAGE ON SCHEMA postgres_exporter TO postgres_exporter;
# 创建函数
CREATE FUNCTION get_pg_stat_activity() RETURNS SETOF pg_stat_activity AS
$$ SELECT * FROM pg_catalog.pg_stat_activity; $$
LANGUAGE sql
VOLATILE
SECURITY DEFINER;
# 创建视图
CREATE VIEW postgres_exporter.pg_stat_activity
AS
  SELECT * from get_pg_stat_activity();
# 视图授权
GRANT SELECT ON postgres_exporter.pg_stat_activity TO postgres_exporter;
# 创建函数
CREATE FUNCTION get_pg_stat_replication() RETURNS SETOF pg_stat_replication AS
$$ SELECT * FROM pg_catalog.pg_stat_replication; $$
LANGUAGE sql
VOLATILE
SECURITY DEFINER;
# 创建视图
CREATE VIEW postgres_exporter.pg_stat_replication
AS
  SELECT * FROM get_pg_stat_replication();
# 视图授权
GRANT SELECT ON postgres_exporter.pg_stat_replication TO postgres_exporter;
grafana
/etc/grafana/grafana.ini
app_mode = production
[paths]
data = /var/lib/grafana
temp_data_lifetime = 24h
logs = /var/log/grafana
plugins = /var/lib/grafana/plugins
[server]
protocol = http
http_port = 3000
domain = gkht
root_url = http://localhost:3000
enable_gzip = true
[database]
log_queries =
[remote_cache]
[session]
provider = file
[dataproxy]
[analytics]
reporting_enabled = false
check_for_updates = false
[security]
admin_user = admin
admin_password = admin
secret_key = SW2YcwTIb9zpOOhoPsMm
[snapshots]
[dashboards]
versions_to_keep = 10
[users]
default_theme = dark
[auth]
[auth.anonymous]
enabled = true
org_role = Viewer
[auth.github]
[auth.google]
[auth.generic_oauth]
[auth.grafana_com]
[auth.proxy]
[auth.basic]
[auth.ldap]
[smtp]
[emails]
[log]
mode = console file
level = info
[log.console]
[log.file]
log_rotate = true
daily_rotate = true
max_days = 7
[log.syslog]
[alerting]
enabled = true
execute_alerts = true
[explore]
[metrics]
enabled           = true
interval_seconds  = 10
[metrics.graphite]
[tracing.jaeger]
[grafana_com]
url = https://grafana.com
[external_image_storage]
[external_image_storage.s3]
[external_image_storage.webdav]
[external_image_storage.gcs]
[external_image_storage.azure_blob]
[external_image_storage.local]
[rendering]
[enterprise]
[panels]
systemd服务
prometheus.service
/usr/lib/systemd/system/prometheus.service
[Unit]
Description=prometheus
After=network.target
[Service]
Type=simple
User=prometheus
ExecStart=/usr/local/bin/prometheus \
          --config.file=/etc/prometheus/prometheus.yml \
          --storage.tsdb.path=/var/lib/prometheus \
          --storage.tsdb.retention.time=15d \
          --storage.tsdb.retention.size=40GB \
          --web.console.templates=/etc/prometheus/consoles \
          --web.console.libraries=/etc/prometheus/console_libraries
ExecReload=/bin/kill -HUP $MAINPID
Restart=on-failure
RestartSec=60s

[Install]
WantedBy=multi-user.target
alertmanager.servicce
/usr/lib/systemd/system/alertmanager.service
[Unit]
Description=alertmanager
After=network.target
[Service]
Type=simple
User=prometheus
ExecStart=/usr/local/bin/alertmanager \
          --config.file=/etc/prometheus/alertmanager.yml \
          --storage.path=/var/lib/alertmanager \
          --data.retention=120h
Restart=on-failure
RestartSec=60s
[Install]
WantedBy=multi-user.target
node_exporter.service
/usr/lib/systemd/system/node_exporter.service
[Unit]
Description=node_exporter
After=network.target
[Service]
Type=simple
User=prometheus
ExecStart=/usr/local/bin/node_exporter
Restart=on-failure
RestartSec=60s
[Install]
WantedBy=multi-user.target
blackbox_exporter.service
/usr/lib/systemd/system/balckbox_exporter.service
[Unit]
Description=blackbox_exporter
After=network.target
[Service]
Type=simple
User=prometheus
ExecStart=/usr/local/bin/blackbox_exporter \
          --config.file=/etc/prometheus/blackbox.yml \
          --web.listen-address=:9115 \
          --log.level=info
Restart=on-failure
RestartSec=60s
[Install]
WantedBy=multi-user.target
mysqld_exporter.service
/usr/lib/systemd/system/mysqld_exporter.service
[Unit]
Description=mysqld_exporter
After=network.target
[Service]
Type=simple
User=prometheus
Environment='DATA_SOURCE_NAME=prometheus:prometheus_password@tcp(127.0.0.1:3306)'
ExecStart=/usr/local/bin/mysqld_exporter \
          --collect.engine_innodb_status \
          --collect.info_schema.innodb_metrics \
          --collect.info_schema.userstats \
          --collect.perf_schema.eventsstatements \
          --collect.perf_schema.indexiowaits \
          --collect.perf_schema.tableiowaits \
          --collect.slave_status \
          --log.level=info \
          --web.listen-address=:9104 \
          --web.telemetry-path=/metrics
Restart=on-failure
RestartSec=60s
[Install]
WantedBy=multi-user.target
postgresql_exporter.service
/usr/lib/systemd/system/postgresql_exporter.service
[Unit]
Description=postgresql_exporter
After=network.target
[Service]
Type=simple
User=prometheus
Environment=DATA_SOURCE_NAME=postgresql://postgres_exporter:password@localhost:5432/postgres?sslmode=disable
ExecStart=/usr/local/bin/postgresql_exporter \
          --web.listen-address=:9187 \
          --web.telemetry-path=/metrics \
          --log.level=info \
          --log.format=logger:stderr
Restart=on-failure
RestartSec=60s
[Install]
WantedBy=multi-user.target
启动服务
修改了systemd脚本之后需要reload一下
systemctl daemon-reload
prometheus
systemctl enable --now prometheus.service
alertmanager
systemctl enable --now alertmanager.service
node_exporter
systemctl enable --now node_exporter.service
grafana
systemctl enable --now grafana.service
其他
其他服务同理,择需启动对应的服务即可
验证服务
prometheus
浏览器访问http://prometheus_server_ip:9090
alertmanager
浏览器访问http://prometheus_server_ip:9093
node_exporter
浏览器访问http://prometheus_server_ip:9100
grafana
浏览器访问http://prometheus_server_ip:3000
默认用户密码admin/admin,初次登录需要改密码
配置grafana监控面板
这里很多作业可以抄,这里简单列举几个我用到的面板
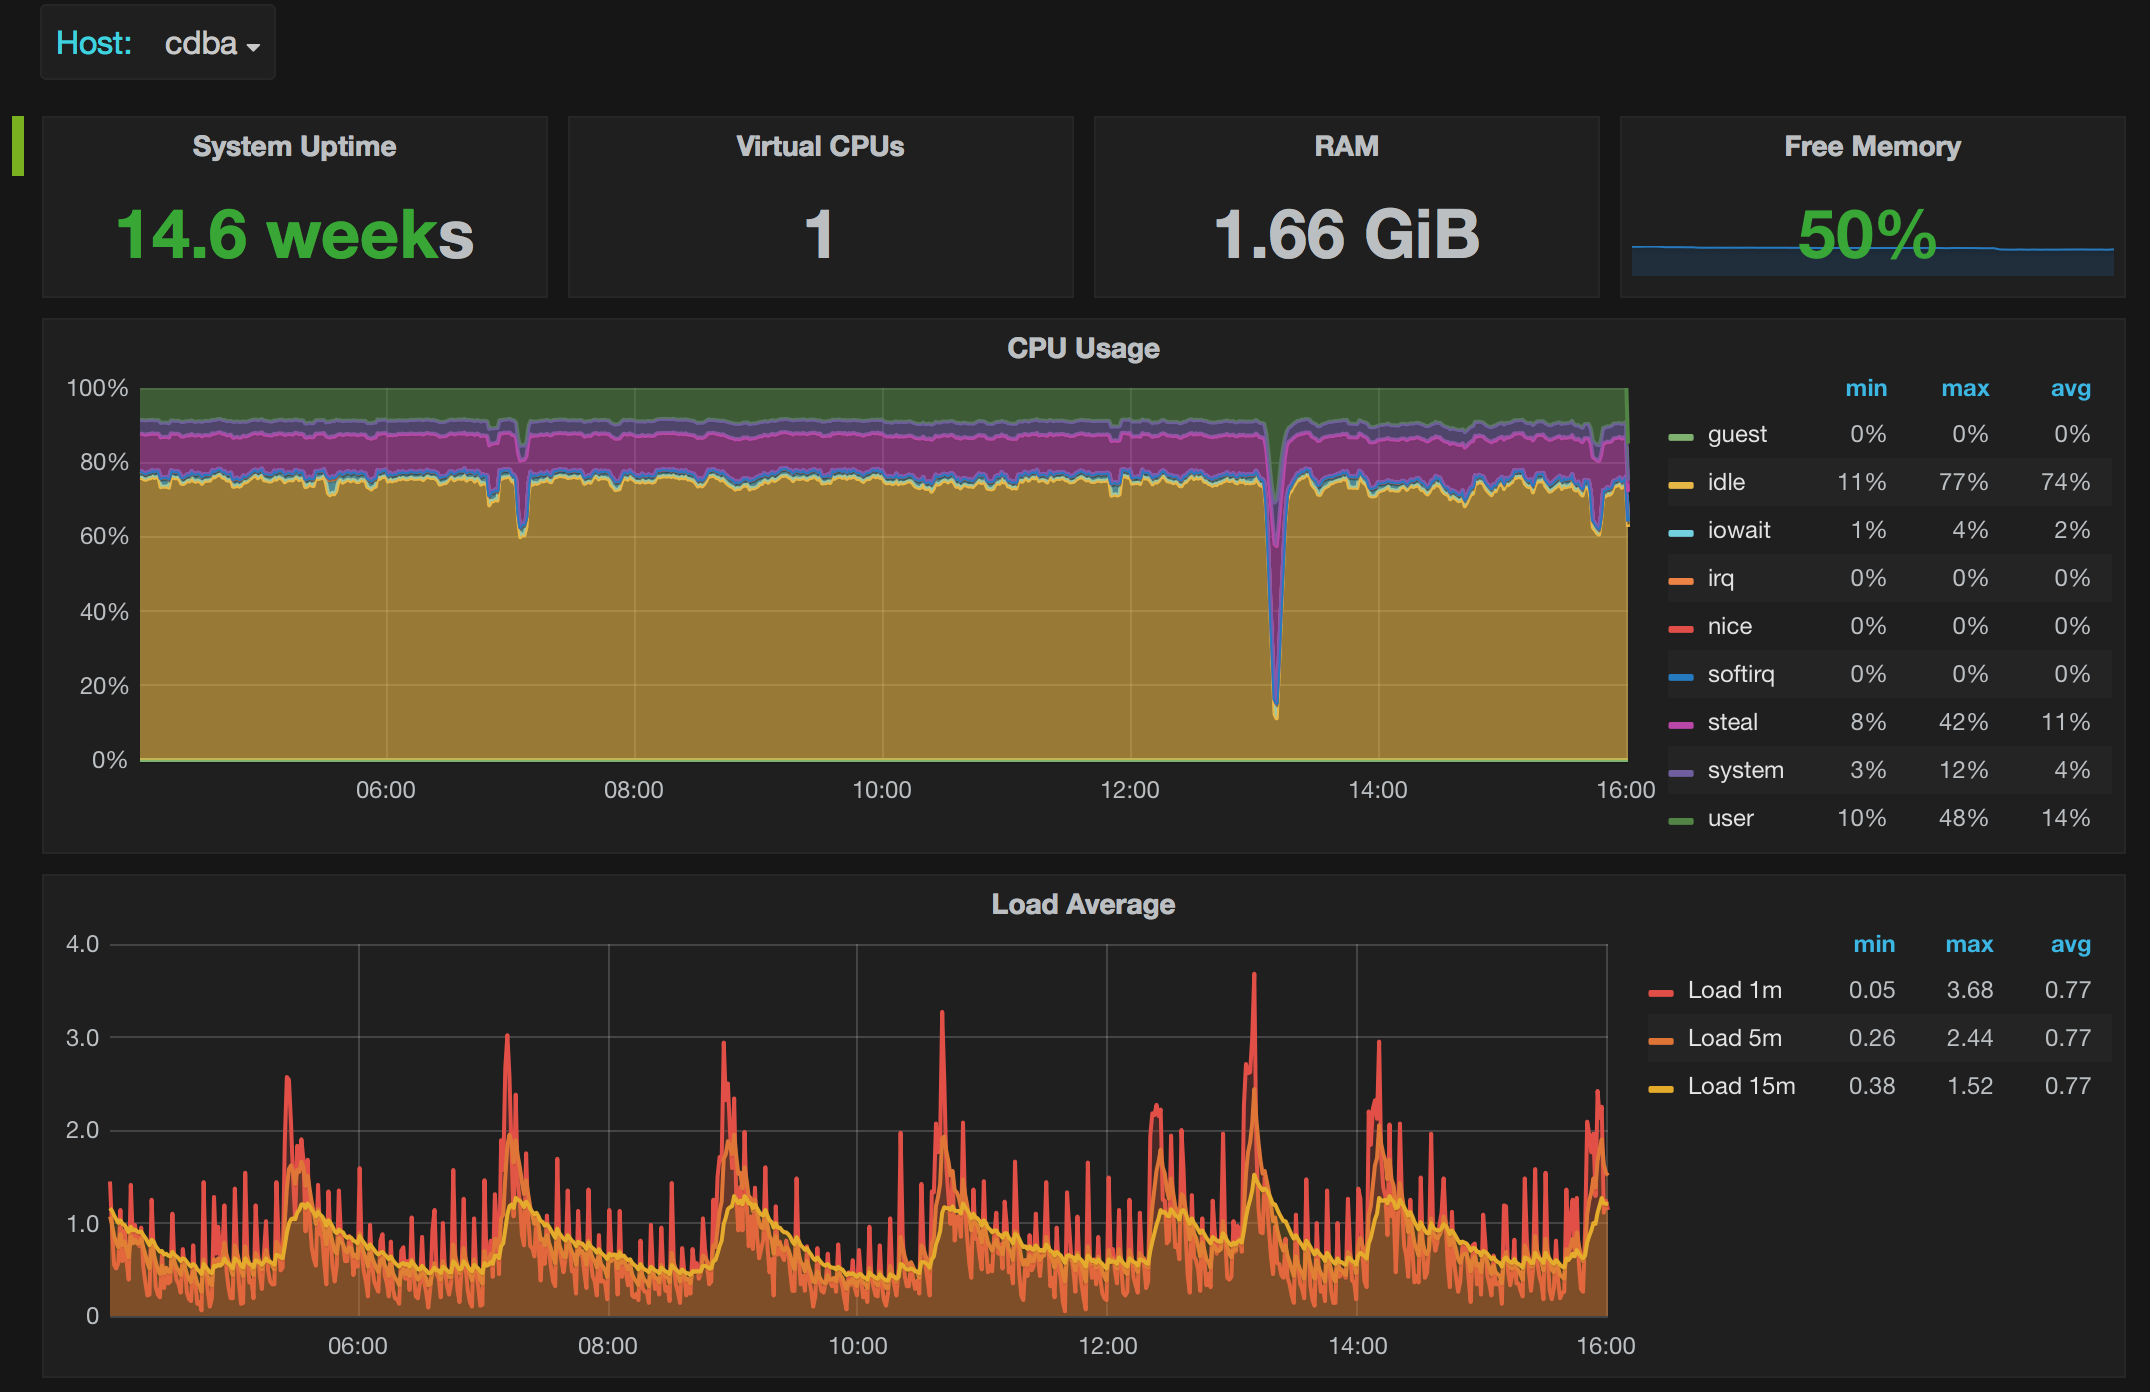
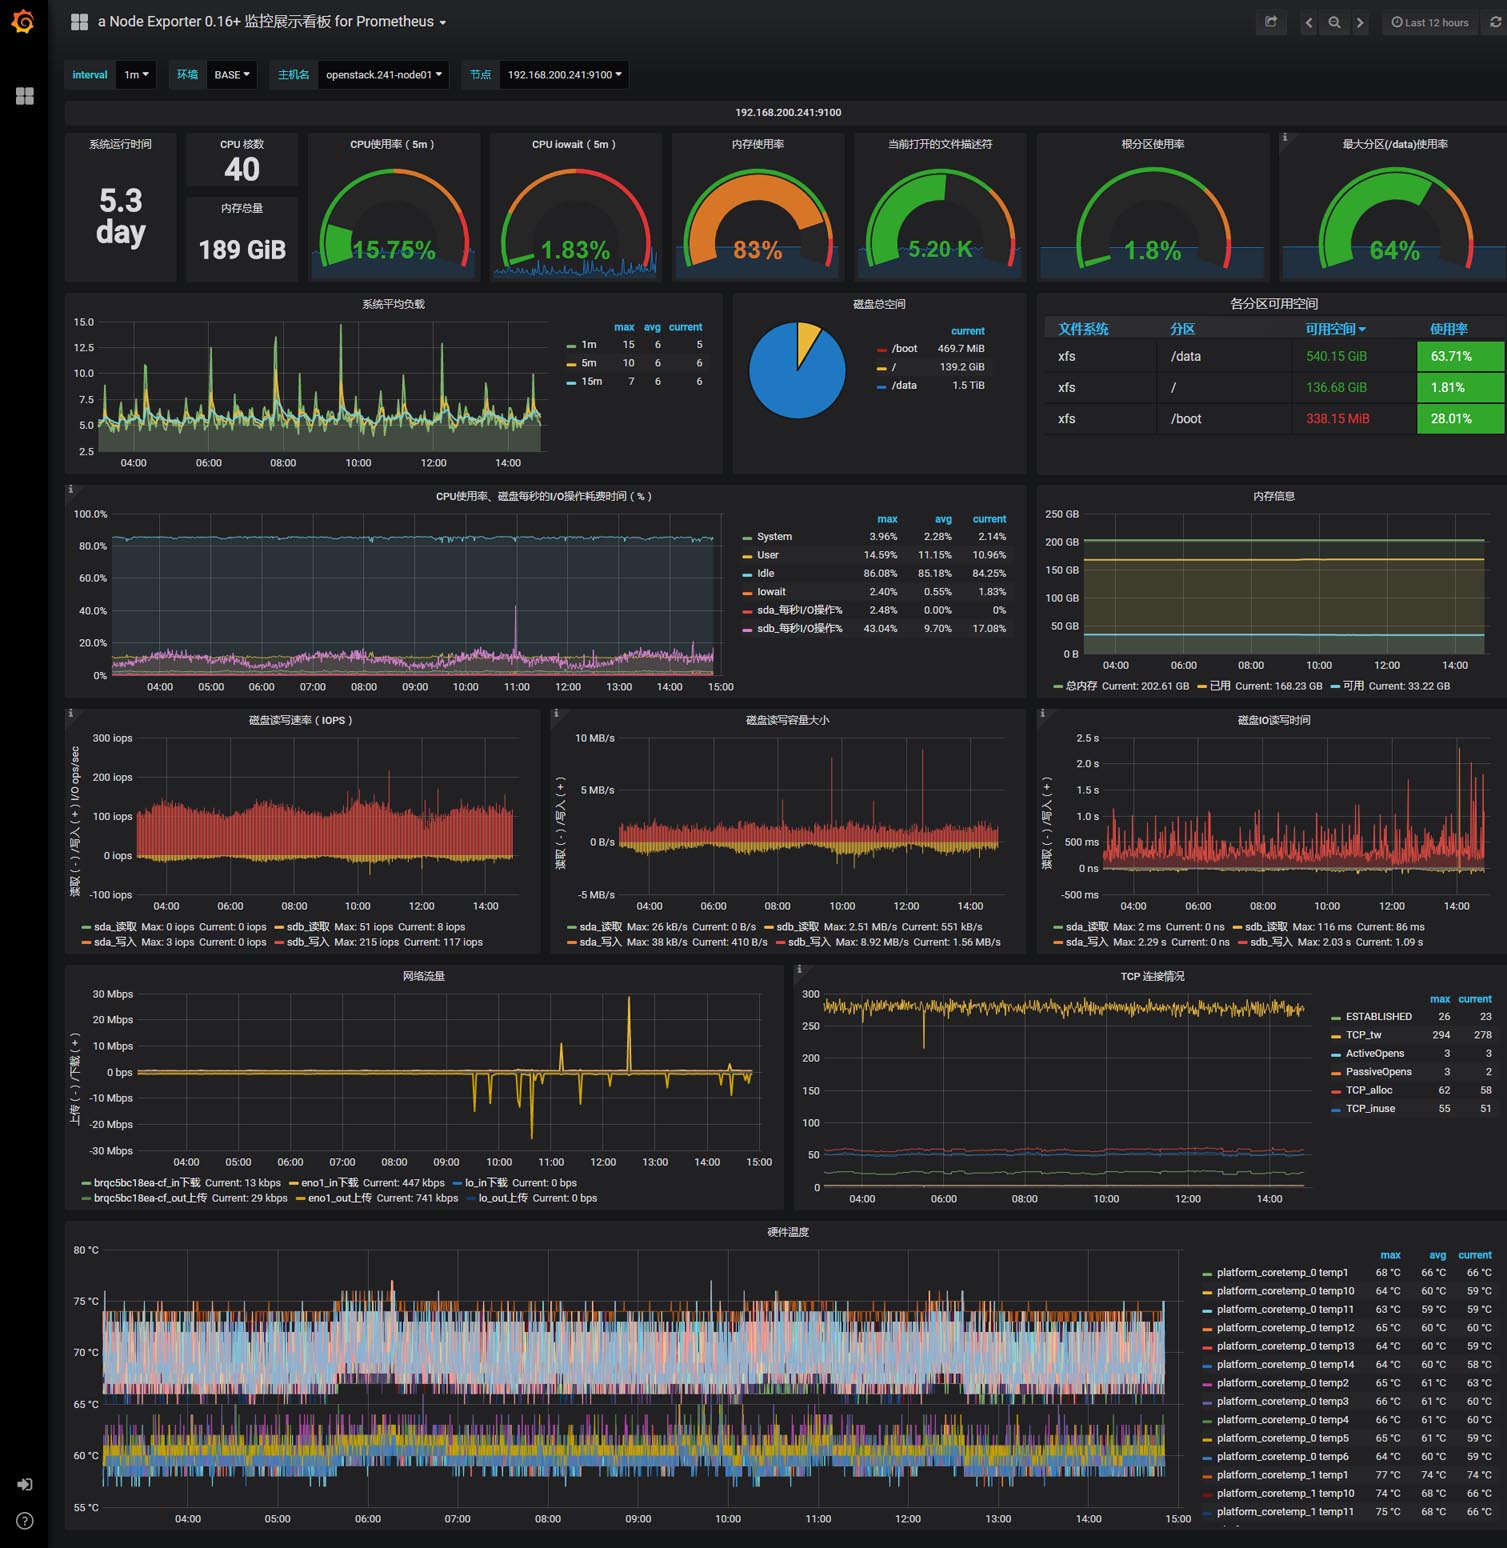
node_exporter面板
1 Node Exporter 0.16–0.18 for Prometheus 监控展示看板
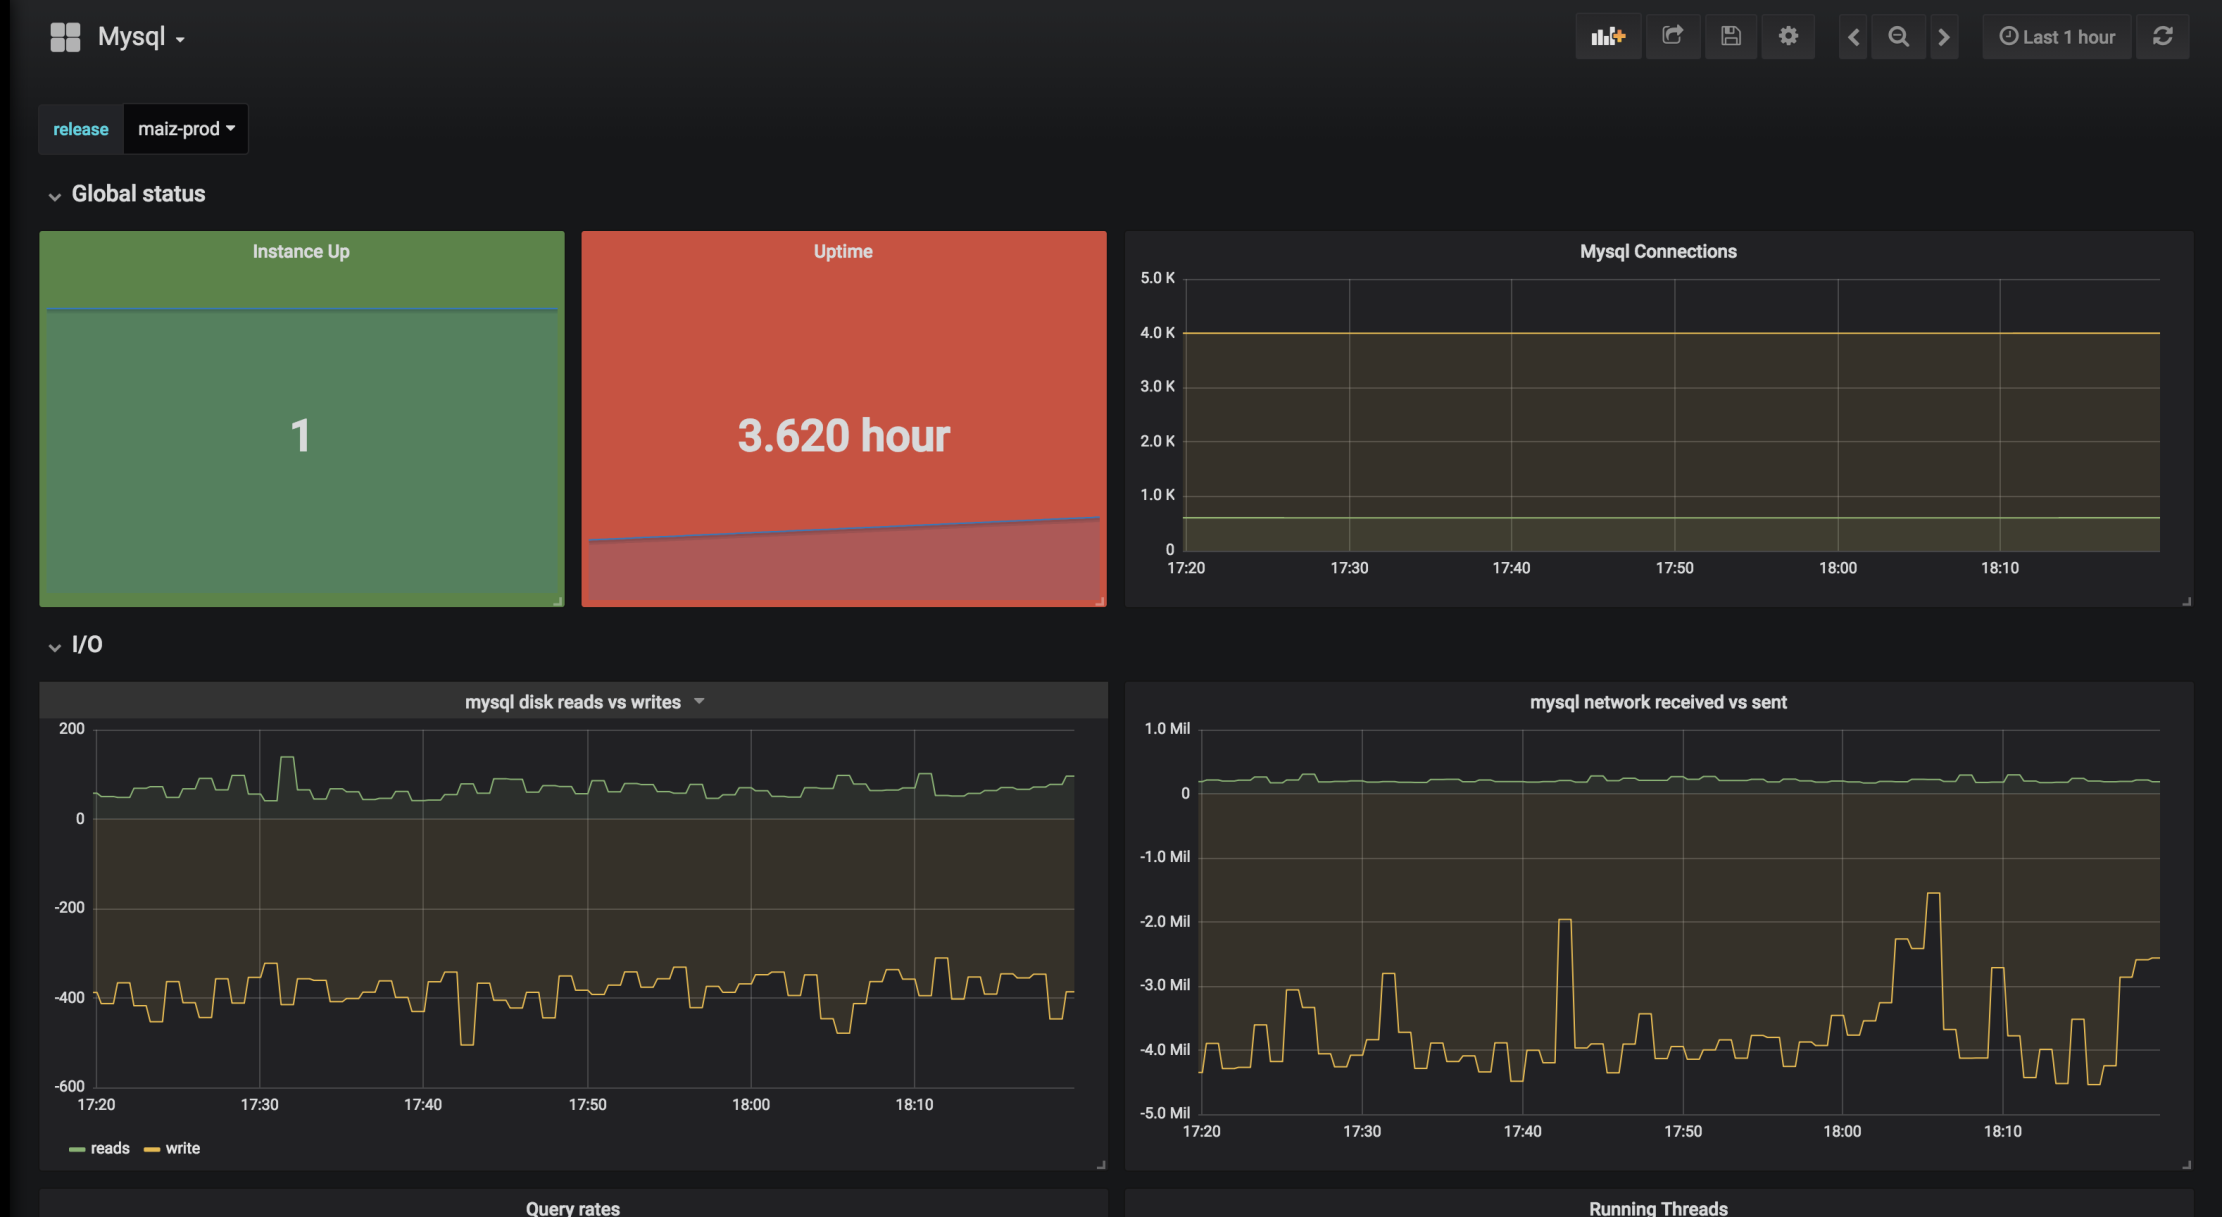
mysqld_exporter面板