监控对象:
1. 监控对象的理解:CPU是怎么工作的,原理
2. 监控对象的指标:CPU使用率 CPU负载 CPU个数 上下文切换
3. 确定性能基准线:怎么样才算故障?CPU负载多上才算高
监控范围:
1.硬件监控服务器的硬件故障
2.操作系统监控 CPU、内存、硬盘、IO、进程
3.应用服务监控 nginx、MySQL、等服务
4.业务监控
硬件监控:
1.使用IPMI
2.机房巡检
远程控制卡:
DELL服务器:iDRAC
HP服务器:ILO ————-Linux就可以使用IPMI(依赖于BMC控制器)
IBM服务器:IMM |
Linux是管理IPMI工具
‘ipmitool’(监控和控制)
1.硬件要支持
2.操作系统 ‘Linux IPMI’
ipmitool安装:
[root@localhost ~]# yum install OpenIPMI ipmitool -y
[root@localhost ~]# rpm -qa OpenIPMI ipmitool
ipmitool-1.8.13-8.el7_1.x86_64
OpenIPMI-2.0.19-11.el7.x86_64
使用IPMI有两种方式
1、本地进行调用
2、远程调用 (IP地址 用户名和密码)
[root@localhost ~]# systemctl start ipmi  #启动
本次以Centos7进行演示
IPMI相关命令
[root@localhost ~]# ipmitool --help
ipmitool: invalid option -- '-'
ipmitool version 1.8.13
usage: ipmitool [options...] <command>
       -h             This help
       -V             Show version information
       -v             Verbose (can use multiple times)
       -c             Display output in comma separated format
       -d N           Specify a /dev/ipmiN device to use (default=0)
       -I intf        Interface to use
       -H hostname    Remote host name for LAN interface
       -p port        Remote RMCP port [default=623]
       -U username    Remote session username
       -f file        Read remote session password from file
       -z size        Change Size of Communication Channel (OEM)
       -S sdr         Use local file for remote SDR cache
       -D tty:b[:s]   Specify the serial device, baud rate to use
                      and, optionally, specify that interface is the system one
       -a             Prompt for remote password
       -Y             Prompt for the Kg key for IPMIv2 authentication
       -e char        Set SOL escape character
       -C ciphersuite Cipher suite to be used by lanplus interface
       -k key         Use Kg key for IPMIv2 authentication
       -y hex_key     Use hexadecimal-encoded Kg key for IPMIv2 authentication
       -L level       Remote session privilege level [default=ADMINISTRATOR]
                      Append a '+' to use name/privilege lookup in RAKP1
       -A authtype    Force use of auth type NONE, PASSWORD, MD2, MD5 or OEM
       -P password    Remote session password
       -E             Read password from IPMI_PASSWORD environment variable
       -K             Read kgkey from IPMI_KGKEY environment variable
       -m address     Set local IPMB address
       -b channel     Set destination channel for bridged request
       -t address     Bridge request to remote target address
       -B channel     Set transit channel for bridged request (dual bridge)
       -T address     Set transit address for bridge request (dual bridge)
       -l lun         Set destination lun for raw commands
       -o oemtype     Setup for OEM (use 'list' to see available OEM types)
       -O seloem      Use file for OEM SEL event descriptions
       -N seconds     Specify timeout for lan [default=2] / lanplus [default=1] interface
       -R retry       Set the number of retries for lan/lanplus interface [default=4]
Interfaces:
    open          Linux OpenIPMI Interface [default]
    imb           Intel IMB Interface
    lan           IPMI v1.5 LAN Interface
    lanplus       IPMI v2.0 RMCP+ LAN Interface
    serial-terminal  Serial Interface, Terminal Mode
    serial-basic  Serial Interface, Basic Mode
Commands:
    raw           Send a RAW IPMI request and print response
    i2c           Send an I2C Master Write-Read command and print response
    spd           Print SPD info from remote I2C device
    lan           Configure LAN Channels
    chassis       Get chassis status and set power state
    power         Shortcut to chassis power commands
    event         Send pre-defined events to MC
    mc            Management Controller status and global enables
    sdr           Print Sensor Data Repository entries and readings
    sensor        Print detailed sensor information
    fru           Print built-in FRU and scan SDR for FRU locators
    gendev        Read/Write Device associated with Generic Device locators sdr
    sel           Print System Event Log (SEL)
    pef           Configure Platform Event Filtering (PEF)
    sol           Configure and connect IPMIv2.0 Serial-over-LAN
    tsol          Configure and connect with Tyan IPMIv1.5 Serial-over-LAN
    isol          Configure IPMIv1.5 Serial-over-LAN
    user          Configure Management Controller users
    channel       Configure Management Controller channels
    session       Print session information
    dcmi          Data Center Management Interface
    sunoem        OEM Commands for Sun servers
    kontronoem    OEM Commands for Kontron devices
    picmg         Run a PICMG/ATCA extended cmd
    fwum          Update IPMC using Kontron OEM Firmware Update Manager
    firewall      Configure Firmware Firewall
    delloem       OEM Commands for Dell systems
    shell         Launch interactive IPMI shell
    exec          Run list of commands from file
    set           Set runtime variable for shell and exec
    hpm           Update HPM components using PICMG HPM.1 file
    ekanalyzer    run FRU-Ekeying analyzer using FRU files
    ime           Update Intel Manageability Engine Firmware
IPMI配置网络,有两种方式:
ipmi over lan(大体意思是通过网卡来进行连接)
独立 (给服务器单独插一个网线) DELL服务器可以在小面板中设置ipmi 云主机我们不需要考虑IPMI
对于路由器和交换机:SNMP
对于这些设备,就不做具体描述了,毕竟没有接触过
系统监控
做为系统运维来说系统监控是重点
- CPU
- 内存
- IO Input/Ouput(网络、磁盘)
CPU三个重要的概念:
1.上下文切换:CPU调度器实施的进程的切换过程,上下文切换
2.运行队列(负载):运行队列,排队 可以参考我是一个进程文章
3.使用率
监控CPU需要确定服务类型:
(1) IO密集型 (数据库)
(2) CPU密集型(Web/mail)
确定性能的基准线
运行队列:1-3个线程 1CPU 4核 负载不超过12
CPU使用:65%-70%用户态利用率
30%-35%内核态利用率
0%-5% 空闲
上下文切换: 越少越好
所有的监控都要根据业务来考虑
常见的系统监控工具
Top、sysstat、mpstat
工具的使用方法
TOP参数解释
top的详细可以参考我在51cto的这篇文章 http://blog.51cto.com/12419955/2052642
其实对于Top,现在我更喜欢htop和gtop,gtop虽然色彩和功能更强大,但是因为gtop不在epel源里,导致gtop的使用没有htop用的广泛
当然gtop这么好用,当然要用一下,这是另一片关于gtop的文章 https://tigerfivegit.github.io/2018/12/14/Linux%E6%80%A7%E8%83%BD%E7%9B%91%E6%8E%A7%E5%B7%A5%E5%85%B7-gtop/
第一行 分别显示:系统当前时间 系统运行时间 当前用户登陆数 系统负载。
系统负载(load average),这里有三个数值,分别是系统最近1分钟,5分钟,15分钟的平均负载。一般对于单个处理器来说,负载在0 — 1.00 之间是正常的,超过1.00就要引起注意了。在多核处理器中,你的系统均值不应该高于处理器核心的总数。
第二行 分别显示:total进程总数、 running正在运行的进程数、 sleeping睡眠的进程数、stopped停止的进程数、 zombie僵尸进程数。
第三行
分别显示:
%us用户空间占用CPU百分比、
%sy内核空间占用CPU百分比、
%ni用户进程空间内改变过优先级的进程占用CPU百分比、
%id空闲CPU百分比、
%wa等待输入输出(I/O)的CPU时间百分比 、
%hi指的是cpu处理硬件中断的时间、%si指的是cpu处理软中断的时间 、
%st用于有虚拟cpu的情况,用来指示被虚拟机偷掉的cpu时间。
通常id%值可以反映一个系统cpu的闲忙程度。
第四行 MEM :total 物理内存总量、 used 使用的物理内存总量、free 空闲内存总量、 buffers 用作内核缓存的内存量。
第五行 SWAP:total 交换区总量、 used使用的交换区总量、free 空闲交换区总量、 cached缓冲的交换区总量。
buffers和cached的区别需要说明一下,buffers指的是块设备的读写缓冲区,cached指的是文件系统本身的页面缓存。它们都是linux操作系统底层的机制,目的就是为了加速对磁盘的访问。
第六行 PID(进程号)、 USER(运行用户)、PR(优先级)、NI(任务nice值)、VIRT(虚拟内存用量)VIRT=SWAP+RES 、RES(物理内存用量)、SHR(共享内存用量)、S(进程状态)、%CPU(CPU占用比)、%MEM(物理内存占用比)、TIME+(累计CPU占 用时间)、 COMMAND 命令名/命令行。
下面简单介绍top命令的使用方法:
top [-] [d]
[q] [c] [C] [S] [n]
运维必会!
参数说明
d指定每两次屏幕信息刷新之间的时间间隔。当然用户可以使用s交互命令来改变之。
p通过指定监控进程ID来仅仅监控某个进程的状态。
q该选项将使top没有任何延迟的进行刷新。如果调用程序有超级用户权限,那么top将以尽可能高的优先级运行。
S指定累计模式。
s使top命令在安全模式中运行。这将去除交互命令所带来的潜在危险。
i使top不显示任何闲置或者僵死进程。
c显示整个命令行而不只是显示命令名。
下面介绍在top命令执行过程中可以使用的一些交互命令
从使用角度来看,熟练的掌握这些命令比掌握选项还重要一些。
这些命令都是单字母的,如果在命令行选项中使用了s选项,则可能其中一些命令会被屏蔽掉。
Ctrl+L 擦除并且重写屏幕。
h或者? 显示帮助画面,给出一些简短的命令总结说明。
k 终止一个进程。系统将提示用户输入需要终止的进程PID,以及需要发送给该进程什么样的信号。一般的终止进程可以使用15信号;如果不能正常结束那就使用信号9强制结束该进程。默认值是信号15。在安全模式中此命令被屏蔽。
i 忽略闲置和僵死进程。这是一个开关式命令。
q 退出程序。
r 重新安排一个进程的优先级别。系统提示用户输入需要改变的进程PID以及需要设置的进程优先级值。输入一个正值将使优先级降低,反之则可以使该进程拥有更高的优先权。默认值是10。
s 改变两次刷新之间的延迟时间。系统将提示用户输入新的时间,单位为s。如果有小数,就换算成m s。输入0值则系统将不断刷新,默认值是5 s。需要注意的是如果设置太小的时间,很可能会引起不断刷新,从而根本来不及看清显示的情况,而且系统负载也会大大增加。
f或者F 从当前显示中添加或者删除项目。
o或者O 改变显示项目的顺序。
l 切换显示平均负载和启动时间信息。
m 切换显示内存信息。
t 切换显示进程和CPU状态信息。
c 切换显示命令名称和完整命令行。
M 根据驻留内存大小进行排序。
P 根据CPU使用百分比大小进行排序。
T 根据时间/累计时间进行排序。
W 将当前设置写入~/.toprc文件中。这是写top配置文件的推荐方法。
Shift+M 可按内存占用情况进行排序。
sysstat 说明
yum install sysstat -y
vmstat --help
usage: vmstat [-V] [-n] [delay [count]]
              -V prints version.
              -n causes the headers not to be reprinted regularly.
              -a print inactive/active page stats.
              -d prints disk statistics
              -D prints disk table
              -p prints disk partition statistics
              -s prints vm table
              -m prints slabinfo
              -t add timestamp to output
              -S unit size
              delay is the delay between updates in seconds.
              unit size k:1000 K:1024 m:1000000 M:1048576 (default is K)
              count is the number of updates.
例子:每隔1秒获取1次,次数不限
# vmstat 1
procs -----------memory---------- ---swap-- -----io---- --system-- -----cpu-----
 r  b   swpd   free   buff  cache   si   so    bi    bo   in   cs us sy id wa st
 0  0      0 547332 177544 535336    0    0     1     6    5   41  1  0 98  0  0
 0  0      0 547324 177544 535336    0    0     0     0  210  445  1  0 99  0  0
 0  0      0 547324 177544 535336    0    0     0     0  195  435  0  0 100  0  0
 0  0      0 547324 177544 535336    0    0     0     0  208  440  1  0 99  0  0
 0  0      0 547332 177544 535336    0    0     0     0  209  446  0  0 100  0  0
 0  0      0 547332 177544 535336    0    0     0     0  207  442  1  1 98  0  0
 0  0      0 547332 177544 535336    0    0     0     0  201  438  0  0 100  0  0
#r表示CPU排队的情况,b代表 进程堵塞,等待io
每隔1秒获取1次,次数10次
# vmstat 1 10
procs -----------memory---------- ---swap-- -----io---- --system-- -----cpu-----
 r  b   swpd   free   buff  cache   si   so    bi    bo   in   cs us sy id wa st
 1  0      0 547340 177544 535344    0    0     1     6    5   41  1  0 98  0  0
 0  0      0 547332 177544 535344    0    0     0    28  210  453  1  1 97  1  0
 0  0      0 547332 177544 535344    0    0     0     0  200  433  0  0 100  0  0
 0  0      0 547332 177544 535344    0    0     0     0  211  445  1  0 99  0  0
 0  0      0 547332 177544 535344    0    0     0     0  201  439  0  1 99  0  0
 0  0      0 547332 177544 535344    0    0     0     0  197  436  0  0 100  0  0
 0  0      0 547332 177544 535344    0    0     0     0  201  442  1  0 99  0  0
 0  0      0 547324 177544 535348    0    0     0     0  240  484  2  1 97  0  0
 0  0      0 547324 177544 535348    0    0     0     0  203  438  0  0 100  0  0
 0  0      0 547324 177544 535348    0    0     0     0  197  430  1  0 99  0  0
mpstat
查看所有CPU的平均值
mpstat 1
Linux 2.6.32-431.23.3.el6.x86_64 (www)  08/30/2016  _x86_64_    (1 CPU)
05:13:22 PM  CPU    %usr   %nice    %sys %iowait    %irq   %soft  %steal  %guest   %idle
05:13:23 PM  all    1.00    0.00    0.00    0.00    0.00    0.00    0.00    0.00   99.00
105:13:24 PM  all    0.00    0.00    0.00    0.00    0.00    0.00    0.00    0.00  100.00
05:13:25 PM  all    2.00    0.00    1.00    0.00    0.00    0.00    0.00    0.00   97.00
05:13:26 PM  all    1.00    0.00    0.00    0.00    0.00    0.00    0.00    0.00   99.00
mpstat 1 10
Linux 2.6.32-431.23.3.el6.x86_64 (www) 08/30/2016 _x86_64_ (1 CPU)
05:13:38 PM CPU %usr %nice %sys %iowait %irq %soft %steal %guest %idle
05:13:39 PM all 2.00 0.00 0.00 0.00 0.00 0.00 0.00 0.00 98.00
05:13:40 PM all 0.00 0.00 1.00 0.00 0.00 0.00 0.00 0.00 99.00
05:13:41 PM all 1.01 0.00 0.00 0.00 0.00 0.00 0.00 0.00 98.99上述是CPU监控,CPU监控主要靠经验。因为业务不同指标不同,指标越低越好是不变的道理
sar命令也有类似的功能,但是sar命令更能看到历史的信息,对于问题排查有更好的作用
当然对于我这种喜欢骚操作的人,sar命令不可能不搞啊,这里放个链接 https://tigerfivegit.github.io/2018/11/21/sar/
内存硬盘监控:
硬盘格式化后分成块(blog)
内存默认是页(大小4kb)读取按照页来进行读取
内存:free vmstat
free -m
             total       used       free     shared    buffers     cached
Mem:          1875       1338        537          0        173        523
-/+ buffers/cache:        640       1234
Swap:            0          0          0
total 总内存
used 已使用内存
free 空闲内存
shared 共享内存(进程间相互通信使用共享内存)
buffers 缓冲
cached 缓存
Centos7 会有一个available,活动内存
#云服务器一般不分配swap分区,物理机能不使用交换分区就不使用交换分区
vmstat 1
procs -----------memory---------- ---swap-- -----io---- --system-- -----cpu-----
 r  b   swpd   free   buff  cache   si   so    bi    bo   in   cs us sy id wa st
 0  0      0 550628 177684 536324    0    0     1     6    7   46  1  0 98  0  0
 0  0      0 550620 177684 536324    0    0     0    40  187  429  0  0 100  0  0
 0  0      0 550620 177684 536324    0    0     0     0  183  427  1  0 99  0  0
 0  0      0 550620 177684 536324    0    0     0     0  197  436  0  1 99  0  0
swpd交换分区的大小
free可用的物理内存大小
buff 缓冲区的大小
cache 缓存区的大小
si 数据从交换分区读取到内存的大小
so 数据从内存到交换分区
bi 从交换分区读到内存(block)
bo 内存写到硬盘的
内存达到多少报警呢? 80%硬盘:IOPS IO’s Per Second iotop df -h iostat
顺序IO(快)
随机IO(慢)
查看磁盘剩余空间
df -h
Filesystem      Size  Used Avail Use% Mounted on
/dev/xvda1       40G  4.1G   34G  11% /
tmpfs           938M     0  938M   0% /dev/shm
监控磁盘IO iotop
yum install iotop -y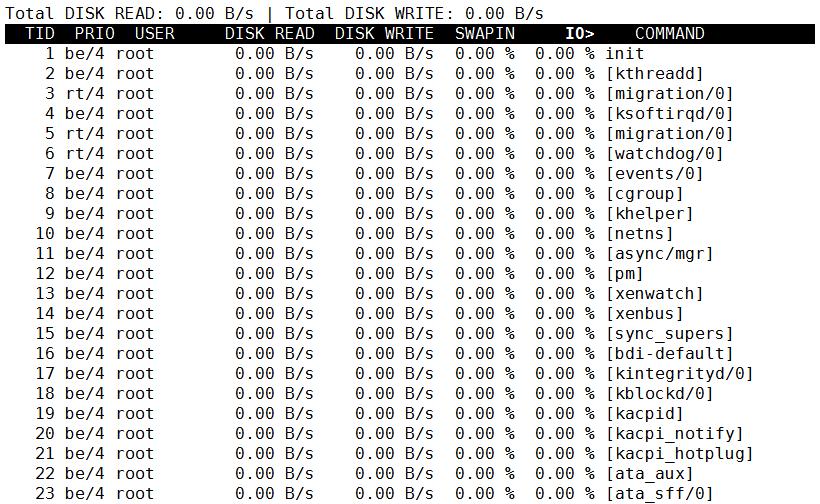
可以使用dd命令生成一个文件夹进行测试
生成命令如下:

# dd if=/dev/zero of=/tmp/1.txt bs=1M count=1000
1000+0 records in
1000+0 records out
1048576000 bytes (1.0 GB) copied, 20.509 s, 51.1 MB/s
[root@www ~]# ls -lh /tmp/1.txt
-rw-r--r-- 1 root root 1000M Aug 30 19:48 /tmp/1.txt
此时IO写入如下图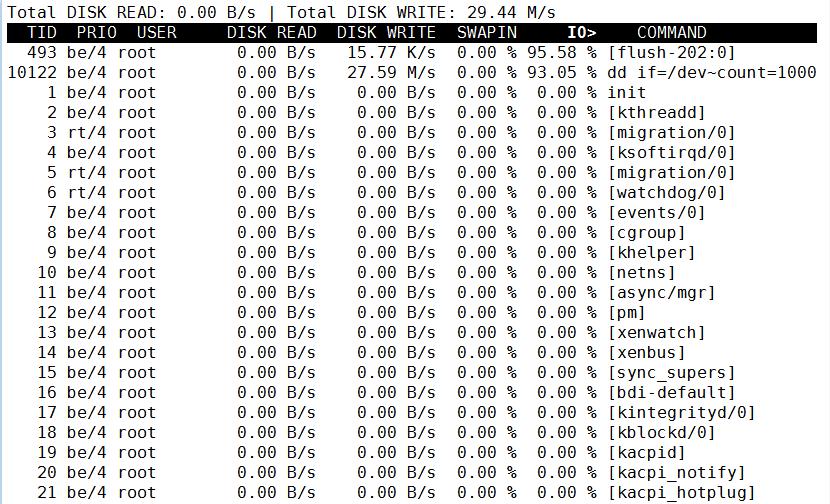
iostat命令,可以看到那块磁盘,比iotop更加细致
# iostat 1 2
Linux 2.6.32-431.23.3.el6.x86_64 (www)  08/30/2016  _x86_64_    (1 CPU)
avg-cpu:  %user   %nice %system %iowait  %steal   %idle
           1.10    0.00    0.27    0.16    0.00   98.46
Device:            tps   Blk_read/s   Blk_wrtn/s   Blk_read   Blk_wrtn
xvda              1.51         2.26        17.09     986748    7467560
avg-cpu:  %user   %nice %system %iowait  %steal   %idle
           1.02    0.00    0.00    0.00    0.00   98.98
Device:            tps   Blk_read/s   Blk_wrtn/s   Blk_read   Blk_wrtn
xvda              0.00         0.00         0.00          0          0
tps 设备每秒的传输次数(每秒多少的io请求)
Blk_read/s 每秒从设备读取的数据量
Blk_wrtn/s 每秒像设备写入的数据量
Blk_read 写入数据的总数
Blk_wrtn 读取数据的总数
网络监控:iftop
# yum install iftop -y
# iftop -n    #-n不做域名解析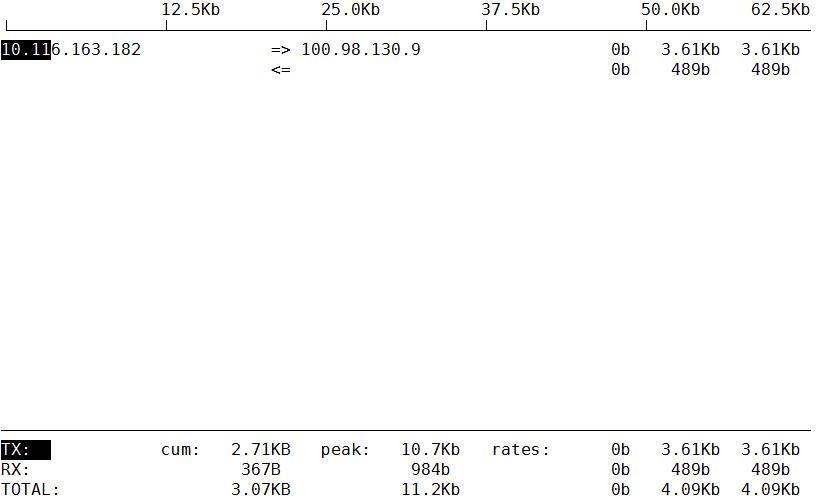
正常监控只需要监控网卡带宽即可
其中网络监控是最复杂的,ping监控网络延迟网络丢包等。但是此类的网络监控只是监控自己到客户端是否丢包,并不能保证客户端到服务器这边不丢包
其中就产生了如:阿里测、奇云测、站长工具等一系列多节点的监控工具
性能测试常用工具:IBM nmon (nmon analyser—生成AIX性能报告的免费工具)
http://nmon.sourceforge.net/pmwiki.php #下载地址(需要翻墙工具)
所以我们提供了百度云下载
链接:http://pan.baidu.com/s/1boXV6R9 密码:sblf
只需要下载对应的版本,给执行权限。执行即可
# chmod +x nmon16e_x86_rhel72
# ./nmon16e_x86_rhel72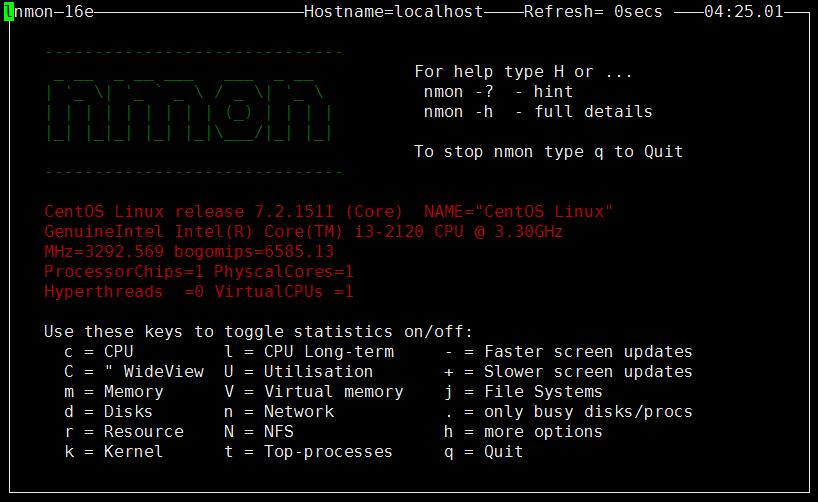
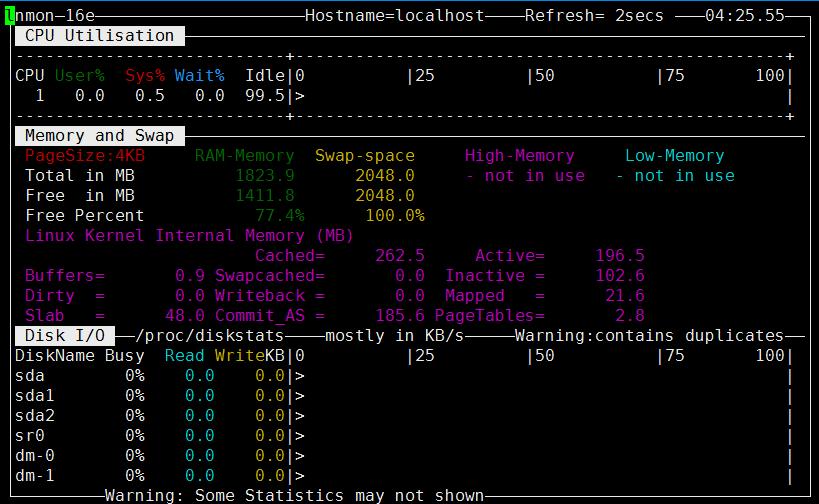
我们可以直接输入一个c 一个m一个d。这个是实时的一个状态
./nmon16e_x86_rhel72 --help
./nmon16e_x86_rhel72: invalid option -- '-'
Hint for nmon16e_x86_rhel72 version 16e
    Full Help Info : nmon16e_x86_rhel72 -h
    On-screen Stats: nmon16e_x86_rhel72
    Data Collection: nmon16e_x86_rhel72 -f [-s <seconds>] [-c <count>] [-t|-T]
    Capacity Plan  : nmon16e_x86_rhel72 -x
Interactive-Mode:
    Read the Welcome screen & at any time type: "h" for more help
    Type "q" to exit nmon
For Data-Collect-Mode
    -f            Must be the first option on the line (switches off interactive mode)
                  Saves data to a CSV Spreadsheet format .nmon file in then local directory
                  Note: -f sets a defaults -s300 -c288    which you can then modify
    Further Data Collection Options:
    -s <seconds>  time between data snapshots
    -c <count>    of snapshots before exiting
    -t            Includes Top Processes stats (-T also collects command arguments)
    -x            Capacity Planning=15 min snapshots for 1 day. (nmon -ft -s 900 -c 96)
---- End of Hints
-c  采集的次数
-s  采集的间隔时间
-f  生成一个文件
-m  指定生成文件位置
采集10次 间隔10秒
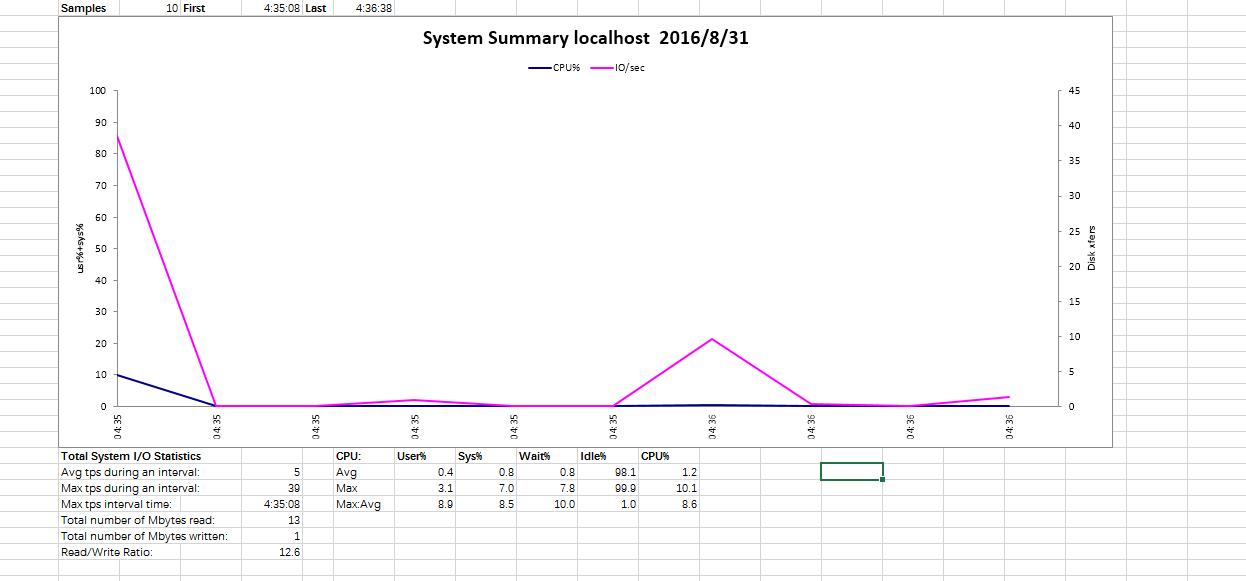
# ./nmon16e_x86_rhel72 -c 10 -s 10 -f -m /tmp/
# ls
localhost_160831_0435.nmon  nmon16e_x86_rhel72
前面为主机名后面是日期(年月日时分)
因为测试可能需要,我们要制作成表格,所以现在将文件上传到桌面上
sz localhost_160831_0435.nmon
我们打开下载的工具
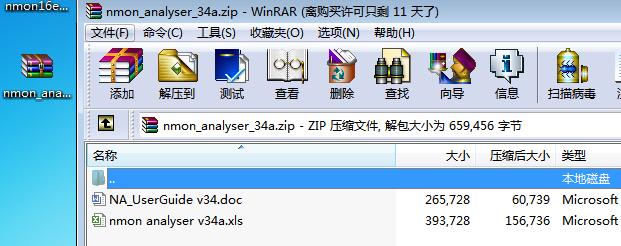
解压文件夹,打开nmon analyser v34a.xls

点击Analyse nmon data找到我们刚刚复制出来的文件,就可以看到了。
应用服务监控:
举例:Nginx
安装nginx
# yum install -y gcc glibc gcc-c++ prce-devel openssl-devel pcre-devel提示:nginx可以使用稳定版的最新版,因为安全性会不断的提高。如果是特别老的版本会有一些漏洞和功能
要想监控nginx需要在编译时添加如下参数
--with-http_stub_status_module下载Nginx
wget http://nginx.org/download/nginx-1.10.1.tar.gz解压,后面步骤太简单不说了
安装
[root@localhost nginx-1.10.1]# useradd -s /sbin/nologin www
[root@localhost nginx-1.10.1]# ./configure --prefix=/usr/local/nginx-1.10.1 --user=www --group=www --with-http_ssl_module --with-http_stub_status_module
#configure 是一个shell脚本,执行它的作用是生成MAKEFILE(编译make需要)
[root@localhost nginx-1.10.1]# make && make install
[root@localhost nginx-1.10.1]# ll
total 676
drwxr-xr-x 6 1001 1001   4096 Aug 31 06:02 auto
-rw-r--r-- 1 1001 1001 262898 May 31 09:47 CHANGES
-rw-r--r-- 1 1001 1001 400701 May 31 09:47 CHANGES.ru
drwxr-xr-x 2 1001 1001   4096 Aug 31 06:02 conf
-rwxr-xr-x 1 1001 1001   2481 May 31 09:47 configure
drwxr-xr-x 4 1001 1001     68 Aug 31 06:02 contrib
drwxr-xr-x 2 1001 1001     38 Aug 31 06:02 html
-rw-r--r-- 1 1001 1001   1397 May 31 09:47 LICENSE
-rw-r--r-- 1 root root    404 Aug 31 07:46 Makefile
drwxr-xr-x 2 1001 1001     20 Aug 31 06:02 man
drwxr-xr-x 3 root root    119 Aug 31 07:46 objs
-rw-r--r-- 1 1001 1001     49 May 31 09:47 README
drwxr-xr-x 9 1001 1001     84 Aug 31 06:02 src
#make是生成文件,make install是将生成的文件拷贝到不同的地方
make install 完成之后可以直接将当前目录拷贝到其他服务器上,安装相同的依赖就可以进行使用。
[root@localhost nginx-1.10.1]# ln -s /usr/local/nginx-1.10.1/ /usr/local/nginx
[root@localhost nginx-1.10.1]# netstat -lntp|grep nginx
tcp        0      0 0.0.0.0:80              0.0.0.0:*               LISTEN      7058/nginx: master
修改nginx.conf配置文件
    location /status {
    stub_status on;
    access_log off;
        allow 192.168.56.0/24;
    deny all;
}
设置只允许56网段访问,并开启日志和状态模块
#这个比较基础,如果不知道怎么添加。可以参考www.nginx.org 状态模块
浏览器访问:http://192.168.56.11/status
Active connections: 1
server accepts handled requests
 3 3 163
Reading: 0 Writing: 1 Waiting: 0
Active connections: 当前活跃的连接数
3—-> 一共处理了多少个链接(请求)
3—-> 成功创建多少次握手
163–> 总共创建了多少个请求
Reading:当前读取客户端heardr的数量
Writing:当前返回给客户端heardr的数量 #如果这个指标飙升,说明是后面的节点挂掉了,例如数据库等。
Waiting:大体意思是已经处理完,等待下次请求的数量
提示:我们只需要关注活动链接即可
监控最基础的功能
采集 存储 展示 告警
几款监控软件说明:
几款监控软件大家都知道应该是zabbix,这个入门和部署比较简单,对于中小企业都是友好的,但是难以细化和深入化。
后来因业务需求从zabbix逐渐转用小米的开源监控open-falcon,这个对于新手不太友好,但是后期的添加和细化都是特别友好的,模块化、分支化